Ok friends, brace yourself for a boring post on dorky graphs. Aside from enjoying time spent with food, travel, and friends, I spend half of my time training and the other half pretty much pivot-tabling my training log data into these fun graphs gems!
1. Shoes by Year
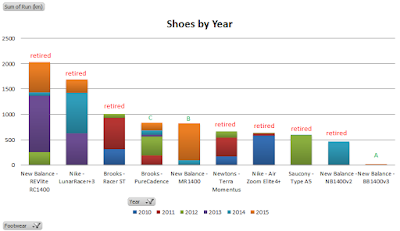
Shoes by year is great. Here's an update of one I had going from the past. My favourites are the New Balance 1400s as I have two pairs of the first generations, one pair of the 2nd (didn't like those as much), and a new 3rd generation.
The Nike LunarRacer+3 were too good too. Forced into retirement, the strands unfortunately and eventually broke after well past its designated design life of 800km and shortly after the mesh started to rip. Shhh, don't tell anyone I got over 1500kms in those shoes.
I also have a hierarchy system of ranking shoes and saving the "A" one for races.
Moving forward (pun intended), I'll need to invest more cushioned shoes as my mileage increases, but in the meantime I'll be sticking to the lightweight shoes.
2. Like a Cashflow Diagram but for Distance and Intensity
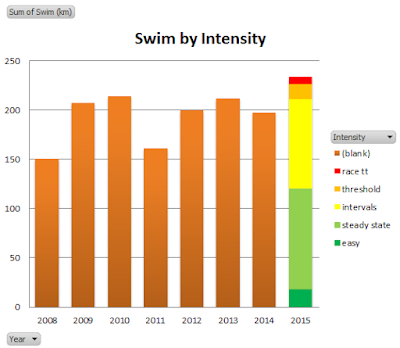
Something new I kept track for 2015 was the daily intensity measure, which was a self precieved effort for the day on a 1 to 5 scale.
Red meant Race Days/Time Trial Efforts,
Orange meant Lactate Threshold,
Yellow meant Intervals,
Limegreen meant Steady State, and
Green meant Easy Only Days.
You'll notice a lot of green after my two big races in Sweden and Muskoka this past year. A lot more running races this year and nicely spaced out with build weeks.
3.Same as no. 2 but aggregated by Years.
Here's some yearly distance tallies for comparison. I had more hard efforts spent on running as compared to biking or swimming.
4. Bike by Terrain
With big fitness gains, comes big responsibilities. You're noticed I biked quite a bit more this past year. I guess bike couriering, leading group rides, and teaching spin classes have certainly contributed close to additional 6000kms on top of regular commute and trainning! I have 4 years of data in terrain. Here's a couple graphs by year, and another by year and bicycle.
5. Lucky Shoes for Long Course Races
Last graph is a good one. I seem to get 3 to 4 solid long-course races with each A-ranked shoes.
I have some more boring graphs that I decided to save for next time!
First Half half-marathon is in 3 weeks. Time to start training! :)


No comments:
Post a Comment